Serving York and York County, PA
Updated
York County sits entirely within the EPA's highest-risk radon zone, but the specific level in any given home still depends on the property's exact foundation and local geology, not just its county. Radon testing in York County, PA is the only way to know a specific address, no matter which town it's in. We provide radon mitigation in York County, PA and the boroughs and townships below.
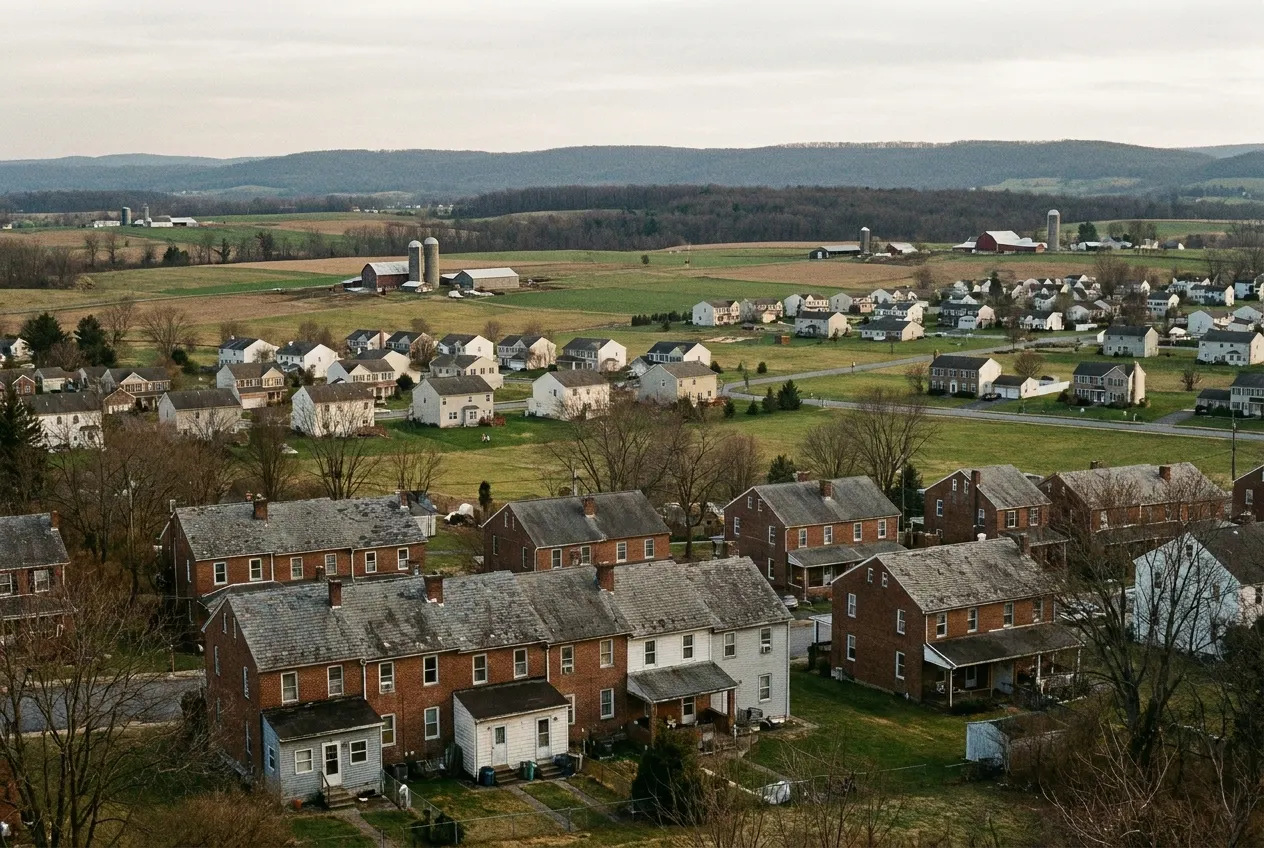
York
The county seat. A mix of older row-home construction downtown and newer development further out, both of which get radon-mitigated with sub-slab systems depending on foundation type.
Dallastown
A borough directly south of York, mostly residential with a mix of basement and slab-on-grade construction.
Red Lion
South of York, historically tied to the cigar-manufacturing industry. Older and newer residential construction mixed throughout.
Dover
Northwest of York, a mix of suburban development and surrounding farmland.
Spring Grove
West of York along Route 116, home to a paper mill and surrounding residential development.
Shrewsbury
Southern York County near the Maryland line, along the Route 83 corridor.
Hanover
Straddling the York/Adams county line to the southwest, a mid-sized borough with a mix of older and newer housing stock.
New Freedom
Southernmost York County borough, right at the Mason-Dixon line.
Dillsburg
Northern York County, near the Cumberland County line.
Stewartstown
Southern York County, a smaller rural borough near the state line.
Why a county-wide service area matters here specifically
York County covers roughly 900 square miles and the geology underneath it is not uniform. The carbonate valleys in the north and west behave differently from the Triassic lowlands and from the older metamorphic rock in the south. Soil permeability varies as much as the bedrock does.
The practical consequence for a homeowner is that a neighbour's result is weak evidence about your own house, and a result from the next township over is close to no evidence at all. What determines a specific reading is the soil directly beneath that foundation, the openings in that slab, and how hard that particular building draws air up from below. See why Pennsylvania is a radon state.
Every county bordering York is also Zone 1
York County is mapped by the EPA in Radon Zone 1, the highest of three categories, meaning a predicted average indoor screening level above 4 pCi/L. So are Adams, Cumberland, Dauphin and Lancaster counties. This is not a York County anomaly, it is a south-central Pennsylvania condition, and the Pennsylvania Department of Environmental Protection states that approximately 40 percent of homes tested statewide read above the action level.
What the zone designation does not do is predict an individual house. The EPA is explicit that the map is a planning and targeting tool. More on what the local numbers do and do not support on York County radon levels.
Housing stock across the county, and what it means for the system
City of York and the older boroughs
Row homes and older detached housing with stone or early block foundations, frequently with a shared party wall. Hollow block walls can carry radon inside the wall cavity, which sometimes calls for block-wall depressurization alongside a slab system. Shared walls also constrain where pipe can be routed.
Post-war and later suburban development
Poured slabs over gravel, which is the easy case, often with an interior perimeter drain tile loop discharging to a sump. Where that loop exists, drawing suction from it is usually the most effective and cheapest option, because the distribution network is already installed.
Rural townships and farm properties
Mixed foundations are the norm rather than the exception: a basement under the original structure, a crawlspace under a later addition, sometimes a slab section too. Those are separate soil-gas environments and usually need separate suction points. Private wells are also common out here, which makes waterborne radon worth considering if air levels stay high after a correctly performing system.
New construction
Newer homes may already have a passive rough-in beneath the slab. Activating it with a fan is far cheaper than a retrofit. Tighter building envelopes also mean less air exchange and therefore less dilution, so a new house is not automatically a low-radon house. See passive vs active and new construction.
Permits and local requirements
Whether a permit is required for a radon mitigation system depends on the borough or township, not on the county, and practice varies across York County. York County's government directory is the starting point for finding a specific municipality's office; within the city itself, the City of York handles its own permitting separately from the county. A quote should state the permit position plainly and say who is pulling it. Statewide, what does not vary is certification: anyone performing this work for compensation in Pennsylvania must hold an active PA DEP certification under the Radon Certification Act. Verify it before you sign. See choosing a contractor.
Radon test data by township and borough
Each page below pulls the PA DEP test records for that municipality's ZIP codes, its housing stock and its geology. Sorted by the share of tests at or above 4.0 pCi/L.
| Municipality | Tests | 4+ pCi/L | 20+ pCi/L |
|---|---|---|---|
| Railroad | 37 | 83.8% | 8.1% |
| Windsor Borough | 864 | 67.1% | 28.2% |
| Dallastown | 2,420 | 65.7% | 23.1% |
| Yoe | 2,420 | 65.7% | 23.1% |
| Fawn Township | 621 | 65.2% | 21.2% |
| Cross Roads | 952 | 65.2% | 26.3% |
| Felton | 952 | 65.2% | 26.3% |
| Fawn Grove | 460 | 64.8% | 20.4% |
| East Hopewell Township | 4,344 | 64.6% | 22.9% |
| Stewartstown | 2,814 | 63.8% | 21.4% |
| Seven Valleys | 1,543 | 63.4% | 24.7% |
| North Hopewell Township | 9,107 | 62.2% | 20.9% |
| Jacobus | 714 | 62.2% | 20.6% |
| Springfield Township | 3,340 | 62% | 22.5% |
| Chanceford Township | 6,509 | 62% | 21% |
| Winterstown | 6,293 | 61.6% | 20.7% |
| Red Lion | 5,341 | 60.9% | 19.7% |
| Glen Rock | 1,797 | 60.8% | 20.6% |
| Lower Chanceford Township | 1,389 | 60.5% | 20.6% |
| Codorus Township | 5,413 | 59.6% | 22.7% |
| Manheim Township | 5,413 | 59.6% | 22.7% |
| Jefferson | 3,003 | 58.6% | 22.9% |
| Spring Grove | 3,003 | 58.6% | 22.9% |
| Mount Wolf | 1,258 | 58.1% | 19.5% |
| Hopewell Township | 5,544 | 58% | 16.4% |
| Delta | 972 | 57.4% | 18.7% |
| Peach Bottom Township | 972 | 57.4% | 18.7% |
| Windsor Township | 16,927 | 57.2% | 16% |
| York Township | 26,831 | 57% | 16% |
| Wrightsville | 1,351 | 56.9% | 16.3% |
| Loganville | 9,933 | 56.5% | 16.7% |
| North Codorus Township | 8,426 | 55.6% | 17.6% |
| Lower Windsor Township | 6,240 | 55.5% | 16.7% |
| Shrewsbury Township | 4,527 | 55.5% | 14.9% |
| East Prospect | 1,446 | 55.4% | 15.8% |
| Spring Garden Township | 8,348 | 55.2% | 15.2% |
| Springettsbury Township | 14,747 | 54.1% | 13.5% |
| Jackson Township | 7,319 | 53.7% | 15.5% |
| Hellam Township | 5,376 | 53.7% | 14.8% |
| Hallam | 4,025 | 52.6% | 14.3% |
| Yorkana | 4,025 | 52.6% | 14.3% |
| New Freedom | 2,730 | 52% | 11.2% |
| Shrewsbury Borough | 2,117 | 52% | 9.6% |
| York City | 17,149 | 51.9% | 10.3% |
| Manchester Township | 12,221 | 51.3% | 8.8% |
| North York | 8,196 | 50.7% | 6.1% |
| West York | 8,196 | 50.7% | 6.1% |
| East Manchester Township | 2,241 | 50.6% | 13% |
| West Manchester Township | 12,076 | 50.5% | 7.6% |
| New Salem | 3,916 | 50.3% | 10.7% |
| Heidelberg Township | 14,823 | 49.4% | 14.5% |
| Paradise Township | 689 | 49.2% | 6.4% |
| Conewago Township | 17,245 | 49.1% | 7.7% |
| Carroll Township | 5,858 | 47.4% | 6.9% |
| Dillsburg | 5,858 | 47.4% | 6.9% |
| Franklin Township | 5,858 | 47.4% | 6.9% |
| Franklintown | 5,858 | 47.4% | 6.9% |
| Hanover | 11,820 | 47% | 12.4% |
| West Manheim Township | 11,820 | 47% | 12.4% |
| Monaghan Township | 8,109 | 46.6% | 6.6% |
| Washington Township | 6,442 | 46.4% | 6.7% |
| Warrington Township | 8,448 | 46% | 6.5% |
| Lewisberry | 2,150 | 44.9% | 5.8% |
| Dover Township | 4,041 | 44.2% | 5% |
| Dover Borough | 4,041 | 44.2% | 5% |
| Fairview Township | 7,156 | 43.4% | 6.9% |
| Goldsboro | 2,905 | 42.1% | 6.4% |
| Newberry Township | 3,939 | 41.8% | 6% |
| Manchester Borough | 983 | 41% | 4.6% |
| York Haven | 1,034 | 40.8% | 4.7% |
| Wellsville | 440 | 33.6% | 4.5% |
Source: PA DEP radon test results, 98,845 York County tests, 1986 to 2026. ZIP codes cross municipal lines, so neighboring rows share some tests.
Don't see your town listed?
We cover York County broadly. Send us your address and we'll confirm whether we can help.
Request a Free Quote